


The purpose of this test is to conduct a comprehensive performance comparison test on the sampled fan filtration unit (FFU) samples, in order to help select FFU products with high energy efficiency and low noise. The testing contents include the air dynamic performance, energy consumption performance and noise performance tests for each FFU sample. For each FFU sample, the relationship between surface wind speed and static pressure, the uniformity of air outflow, as well as the current, voltage, power and noise of the FFU are tested under six different rotational speeds (corresponding to 0.30m/s@90Pa, 0.35m/s@90Pa, 0.40m/s@90Pa, 0.45m/s@90Pa, 0.50m/s@90Pa, 0.60m/s@90Pa) respectively.
一、Testing standards
1、(JG/T 388-2012)《Fan Filter Unit Marking》
2、(GB/T 14549)《Power quality - Public power grid - Harmonics》
3、(BS-EN-ISO-3743-1)《Acoustics - Measuring the sound power level of a noise source using sound pressure. Field comparison method.》
二、 Test Requirements
2.1Spectral parameter testing
The test point is located 1500mm below the filter.
2.2 Face wind speed uniformity test
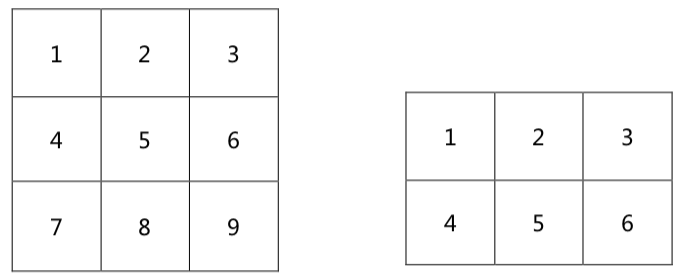
The layout of the test points for measuring the uniformity of face wind speed is shown in the figure. The test points are ensured to be located at a horizontal plane 150mm below the filter, and for 4×4 FFU, 9 points are selected (for 2×4 FFU, 6 points are selected).
2.3Vibration analysis test
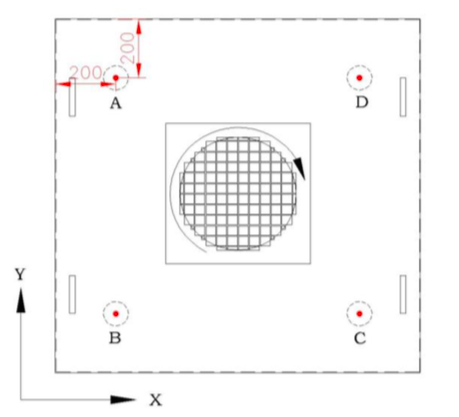
The layout of the vibration analysis test points is shown in the figure.
2.4 Static pressure box
The height of the ceiling return air static pressure box is 1.2 meters.
2.5 Retrieve data
Measure randomly 6 times and take the average value as the final test data.
三、The test results show
3.1 Testing conditions for the FFU samples:
|
Box size |
: |
1175 X 1175 X (320+35) mm |
|
Box material |
: |
GALVALUME 0.8mm |
|
Filter size |
: |
1170 x 1170 x 50 mm |
|
Filter type |
: |
PTFE (fold height35mm) |
|
Filter efficiency |
: |
PTFE 99.995%@0.3 MPPS H14 |
|
Initial resistance of the filte |
: |
46Pa@0.45m/s |
|
Fan |
: |
EC R3G400AC30-61 |
|
Governor |
: |
Manual control, computer control |
|
Power supply |
: |
1P 220V 50Hz |
3.2 Test environment for the FFU samples:
|
Laboratory temperature |
: |
25 ℃ |
|
Noise |
: |
30 dBA |
3.3 Test results of the FFU samples being tested::
|
Wind speed on the surface |
m/s |
0.297 |
0.346 |
0.397 |
0.451 |
0.501 |
0.554 |
|
Energy consumption |
W |
90.0 |
108.0 |
125.0 |
148.0 |
171.0 |
201.0 |
|
Electric current |
A |
0.471 |
0.553 |
0.603 |
0.699 |
0.800 |
0.906 |
|
Power factor |
% |
97.000 |
97.800 |
98.200 |
99.000 |
99.500 |
99.600 |
|
Fan speed |
Rpm |
800 |
845 |
901 |
969 |
1025 |
1106 |
|
Noise |
dBA |
43.6 |
45.0 |
47.5 |
49.7 |
50.8 |
52.6 |
|
Filter pressure loss |
Pa |
30.0 |
35.0 |
39.0 |
45.0 |
49.0 |
56.0 |
|
Exhaust static pressure |
Pa |
90.0 |
90.0 |
90.0 |
90.0 |
90.0 |
90.0 |
|
Total pressure |
Pa |
120.0 |
125.0 |
129.0 |
135.0 |
139.0 |
146.0 |
|
Vibration |
mm/s |
0.035 |
0.045 |
0.058 |
0.078 |
0.095 |
0.110 |
|
Current harmonics |
% |
13.5 |
11.4 |
8.2 |
5.3 |
3.3 |
3.0 |
|
Voltage harmonics |
% |
3.5 |
3.5 |
3.5 |
3.5 |
3.5 |
3.5 |
|
Wind speed uniformity |
% |
5.84 |
5.99 |
6.43 |
5.70 |
5.60 |
6.26 |
|
Overall machine efficiency |
% |
51.41 |
51.98 |
53.20 |
53.48 |
52.94 |
52.34 |
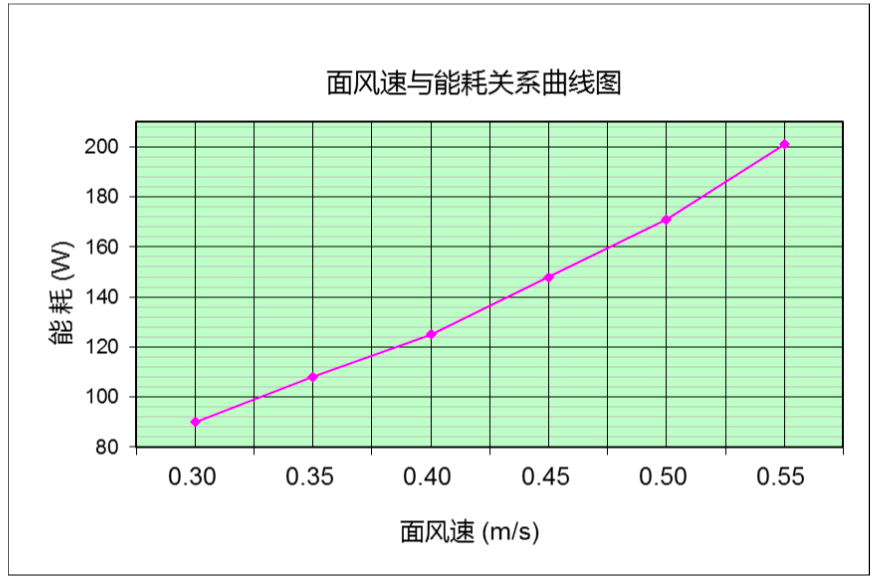
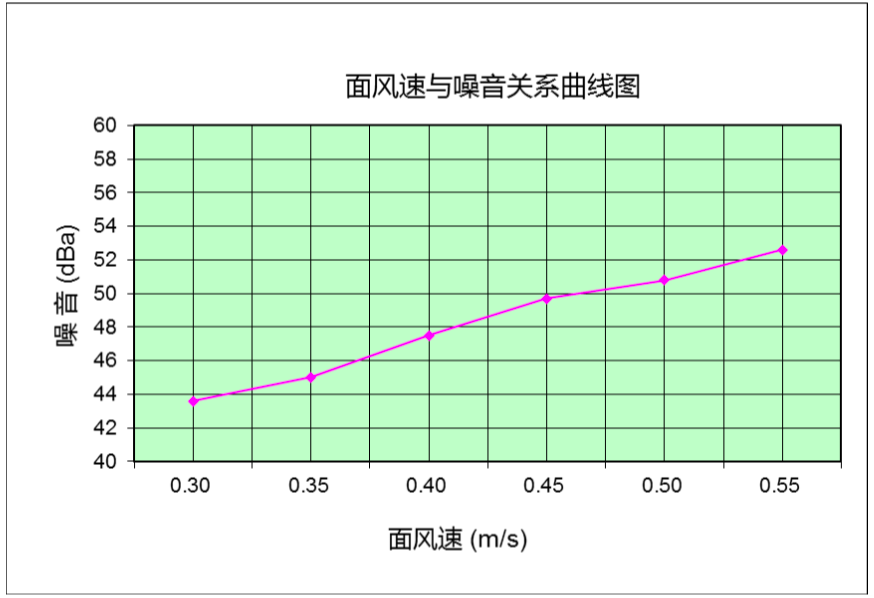
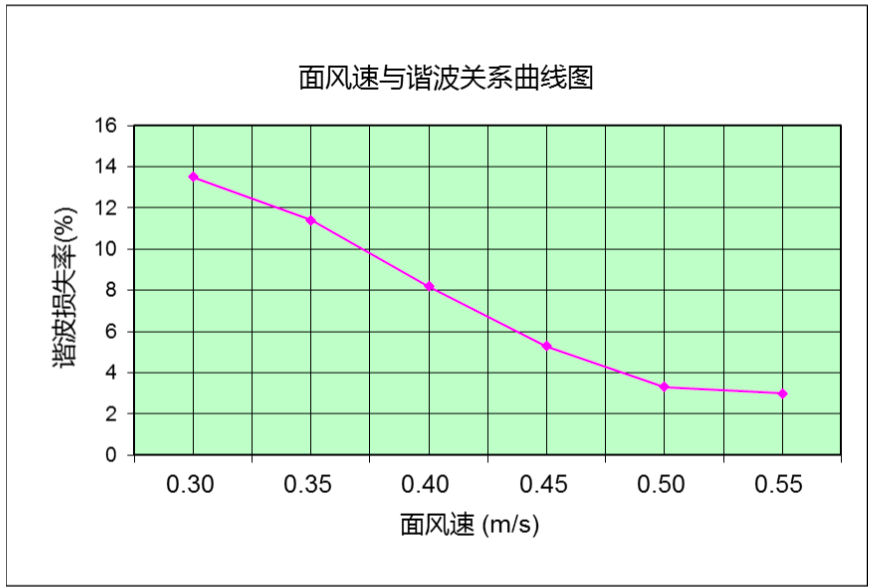
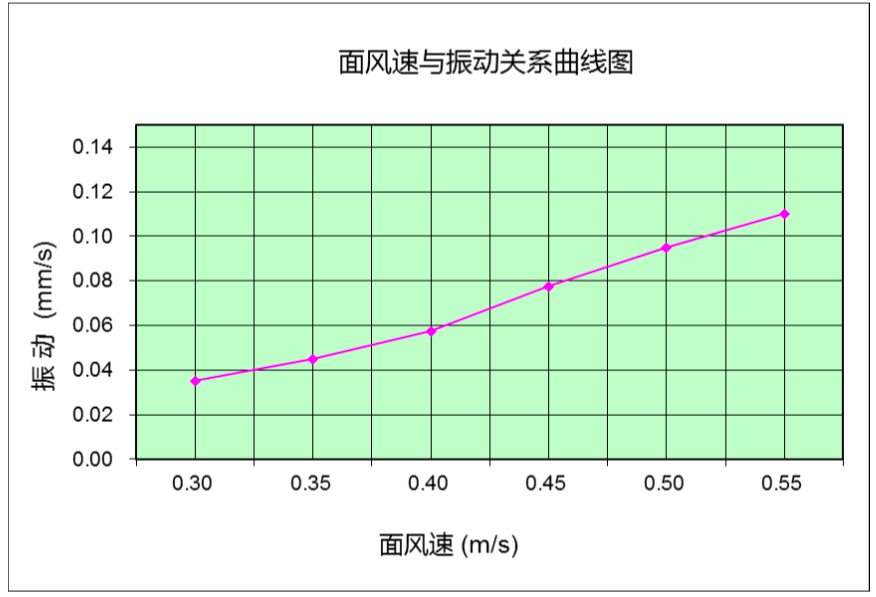
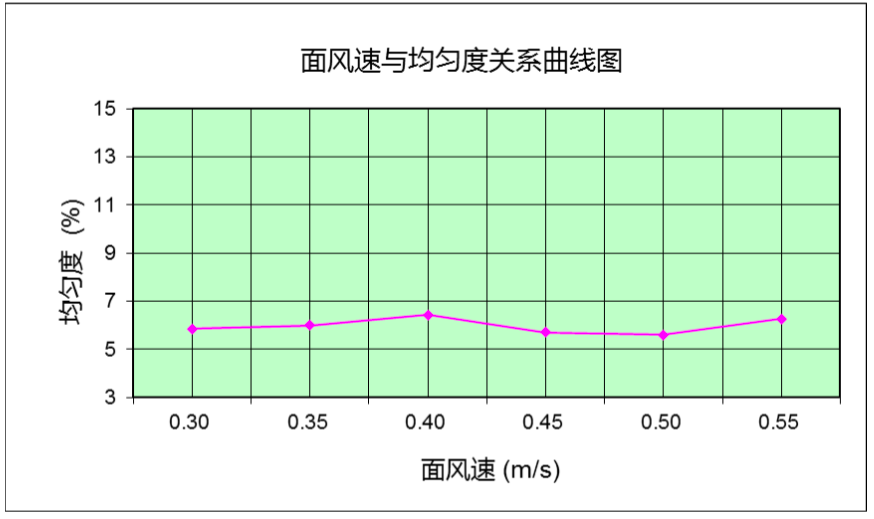
3.4Curve graph showing the relationship between the surface wind speed of the tested FFU sample and various parameters
Yejia's China regional website:Http://www.aireplus.com.cn